
In 2022, the post-pandemic economic recovery fell short of expectations due to fiscal and monetary tightening. High inflation resulting from global supply chain disruption, geopolitical events such as the Russia-Ukraine War, and China’s COVID-19 restrictions added uncertainty to financial markets. Despite these challenges, we achieved solid investment results, with total investment income increasing by 9.5% to KRW 268.1 billion excluding foreign exchange gains/losses in 2022. The value of our investments grew by 18.7% to KRW 8,504 billion.
The significant growth of our invested assets was driven by the issuance of hybrid capital securities and the transfer of assets from two different life insurers through coinsurance contracts. Our investment in stock and private equity performed strongly, and returns from domestic bonds improved steadily, as we were able to take advantage of rate hikes from the central bank, which contributed to a rise in overall investment profit.
In 2022, the Korean economy slowed down, growing by 2.6% for the full year, which was still slightly above the last five-year average. In the fourth quarter of the year, economic output even decreased by 0.4% from the previous quarter, posting negative growth for the first time since the second quarter of 2020. Global economic growth also slowed throughout 2022 due to rapid and drastic interest rate hikes. The policy rate in Korea increased from 1.0% to 3.25% at the end of the year, while the U.S. Federal Reserve raised interest rates by 4.25%p in seven rate hikes.
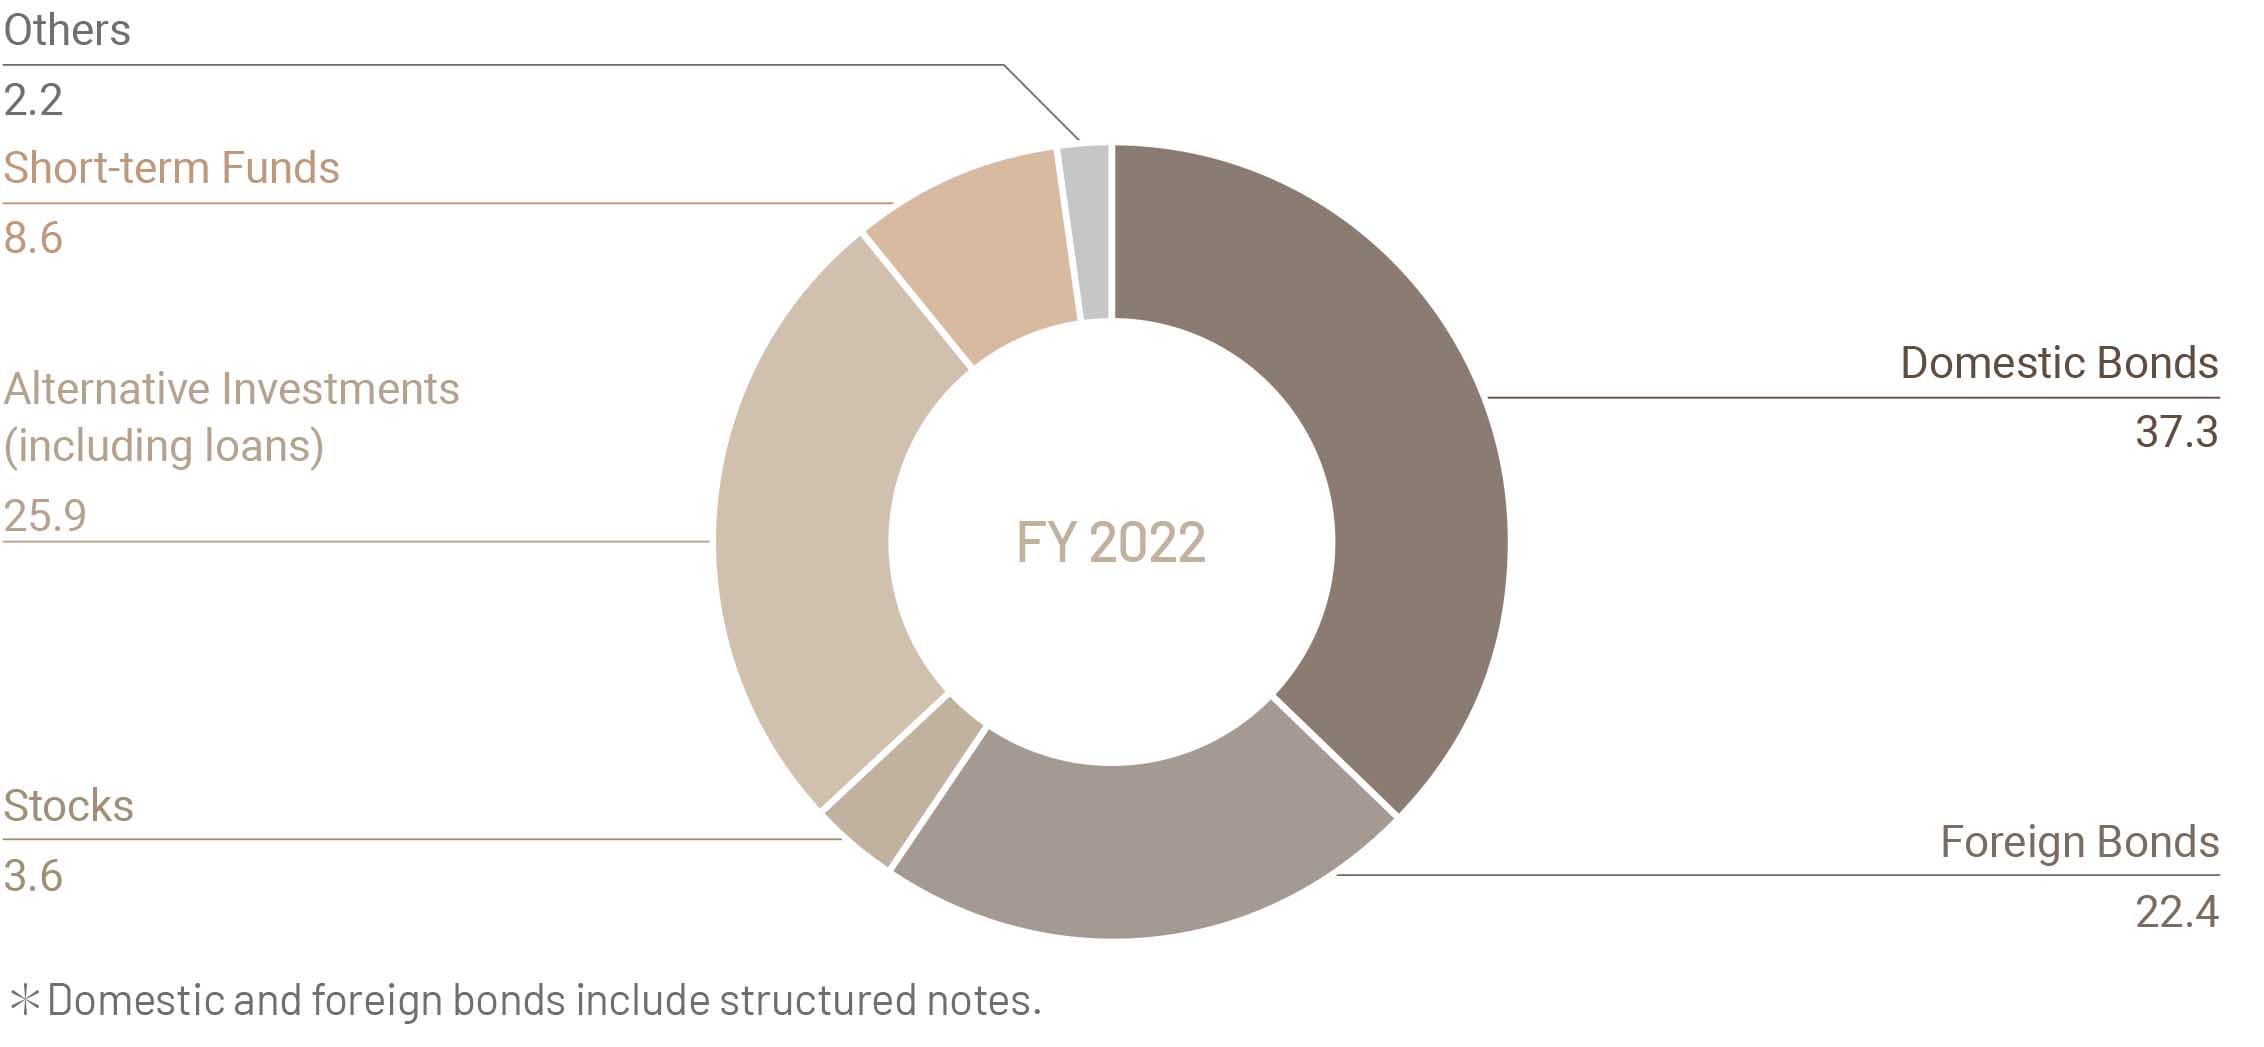
The current rising interest rate environment has altered the investment landscape, boosting returns on our new investments, especially in fixed-income assets. Since most of the transferred assets from coinsurance were invested in fixed-income assets, our bond holdings, including structured notes, accounted for 59.7% (or approximately KRW 5.08 trillion) of the total invested assets at the end of 2022. Consequently, our fixed-income returns grew by 18% without any gains from sale, and they occupied nearly half (48.6%) of our total investment income. We are seeking various methods to capitalize on this period of high interest rates, such as contracting bond forward derivatives to maintain a high level of profit, while simultaneously pursuing effective asset-liability management.
In 2022, our alternative investments performed fairly well following 2021. With 38.4% of our investment income coming from the alternative asset class, we realized a capital gain of KRW 27.1 billion. Most of our alternative investment vehicles are loans, including real estate project financing, acquisition financing, and loan-linked products. Our stock investment portfolio also achieved gains of KRW 28.4 billion, backed by diversification strategies and dividends. As we enter 2023, we anticipate that consumption recovery will substantially weaken, with exports slowing down and inflation likely moderating to a certain level above the central bank’s target. We still expect a further upside to the policy rate in the first half of 2023, and we are also looking into the possibility of a recession carefully. The stock market suffered broad setbacks throughout the last year, with the Korea Composite Stock Price Index (KOSPI) closing at 2,236.4p, representing a 24.9% decrease for the year. The trading volume also dropped sharply amid bearish market sentiment.
Throughout the upcoming year, our asset management strategy will be focused on mitigating potential market uncertainties while maintaining our investment income. We will achieve this goal by making a meaningful reduction in the risk associated with our investment portfolio. More specifically, we intend to increase the weight of Treasury bonds in our portfolio while decreasing the relative importance of corporate bonds and alternative investments.
Although alternative investments have played a significant role in our investment profit, the implementation of the new capital adequacy regime, or K-ICS, requires a more conservative approach to asset management. Under K-ICS, the risk charges for alternative investments increase compared to those under the previous RBC system. Moreover, large exposure to alternative investments will likely lead to financial earnings volatility due to the introduction of the new accounting principles, IFRS 9. Amid these implications, 2023 is set to be a transformative year for insurers, necessitating essential changes in investment strategies to mitigate earnings uncertainty and enhance capital adequacy.
In line with our asset management strategy, we will respond proactively to major regulatory changes to ensure stable investment results as we continue to build on the strength of our investment assets. We will also continue to seek out new investment opportunities and strategies to maximize overall profitability throughout the year.
Investment Portfolio Mix in 2022
(Units: %)
Investment Results
(Units: KRW billion, USD million)
| FY 2022 (KRW) | FY 2022 (USD) | FY 2021 (KRW) | FY 2021 (USD) | |
| Invested Assets | 8,503.7 | 6,645.1 | 7,161.4 | 5,982.3 |
| Investment Income | 272.5 | 209.7 | 306.3 | 266.5 |
| Investment Income* | 268.1 | 206.3 | 244.8 | 213.0 |
| Yield (%) | 3.5 | 3.5 | 4.5 | 4.5 |
| Yield* (%) | 3.5 | 3.5 | 3.7 | 3.7 |
* Gains and/or losses from foreign exchange hedging for insurance liabilities have been excluded.
Investment Income
(Units: KRW billion, USD million)
| FY 2022 (KRW) | FY 2022 (USD) | FY 2021 (KRW) | FY 2021 (USD) | |
| Domestic Bonds | 72.1 | 55.5 | 54.0 | 47.0 |
| Foreign Bonds | 57.2 | 44.0 | 118.2 | 102.8 |
| Foreign Bonds* | 58.3 | 44.9 | 56.7 | 49.3 |
| Stocks | 28.4 | 21.8 | 48.0 | 41.8 |
| Alternative Investments (including loans) | 103.1 | 79.3 | 125.1 | 108.8 |
| Short-term Funds | 10.9 | 8.4 | 7.0 | 6.1 |
| Others | -4.7 | -3.6 | -2.8 | -2.4 |
| Total | 272.5 | 209.7 | 306.3 | 266.5 |
| Total* | 268.1 | 206.3 | 244.8 | 213.0 |
* Gains and/or losses from foreign exchange hedging for insurance liabilities have been excluded.
✽ Individual figures may not add up to the total shown due to rounding.
Invested Assets
(Units: KRW billion, USD million)
| FY 2022 (KRW) | FY 2022 (USD) | FY 2021 (KRW) | FY 2021 (USD) | |
| Domestic Bonds | 3,172.3 | 2,478.9 | 2,152.2 | 1,797.8 |
| Foreign Bonds | 1,908.2 | 1,491.1 | 1,730.1 | 1,445.2 |
| Stocks | 303.3 | 237.0 | 287.2 | 239.9 |
| Alternative Investments (including loans) | 2,199.3 | 1,718.6 | 2,050.8 | 1,713.1 |
| Short-term Funds | 735.0 | 574.4 | 755.8 | 631.4 |
| Others | 185.6 | -3.6 | 185.3 | 154.8 |
| Total | 8,503.7 | 145.0 | 7,161.4 | 5,982.3 |
✽ Individual figures may not add up to the total shown due to rounding.